🚦 “No Trend Goes Unnoticed – Detect In & Out Candlestick Patterns Instantly!”
📌 Indicator Overview
Name: NO SIGNAL
Version: 1.00
Platform: MetaTrader 4 (MT4)
Chart Type: Main Chart Window
Type: Candlestick Pattern Detector
Visual Style: Histogram-style vertical line markers
Developer: R.KH 1001
Website: https://www.robomql.com
This indicator is built to detect and visually highlight two specific candlestick patterns:
IN pattern (bullish engulfing structure)
OUT pattern (bearish engulfing structure)
🧠 How It Works
The indicator scans through historical candles to identify two types of 2-bar reversal patterns based on price action comparisons. It evaluates highs, lows, opens, and closes across three consecutive candles and displays signals visually as vertical histogram bars on the chart.
🔍 Pattern Definitions
✅ IN Pattern (Bullish Reversal Signal)
Triggers when:
Current Low Previous bar's Low
Current Close Previous bar's Close
Previous Close Previous Open (bearish candle)
Current Close Current Open (bullish candle)
Interpretation: The market is potentially reversing upward.
❌ OUT Pattern (Bearish Reversal Signal)
Triggers when:
Current High Previous High
Current Close Previous Close
Previous Close Previous Open (bullish candle)
Current Close Current Open (bearish candle)
Interpretation: The market is potentially reversing downward.
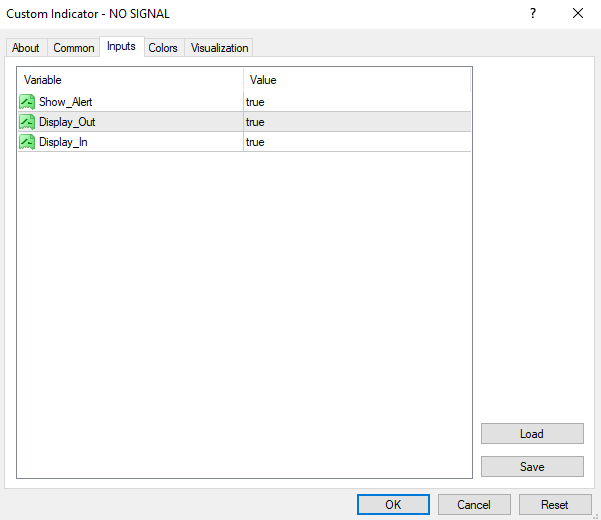
⚙️ Input Parameters
ParameterTypeDescription
Show_AlertboolEnables/disables alerts when a pattern is found
Display_OutboolEnables display of bearish "Out" pattern on chart
Display_InboolEnables display of bullish "In" pattern on chart
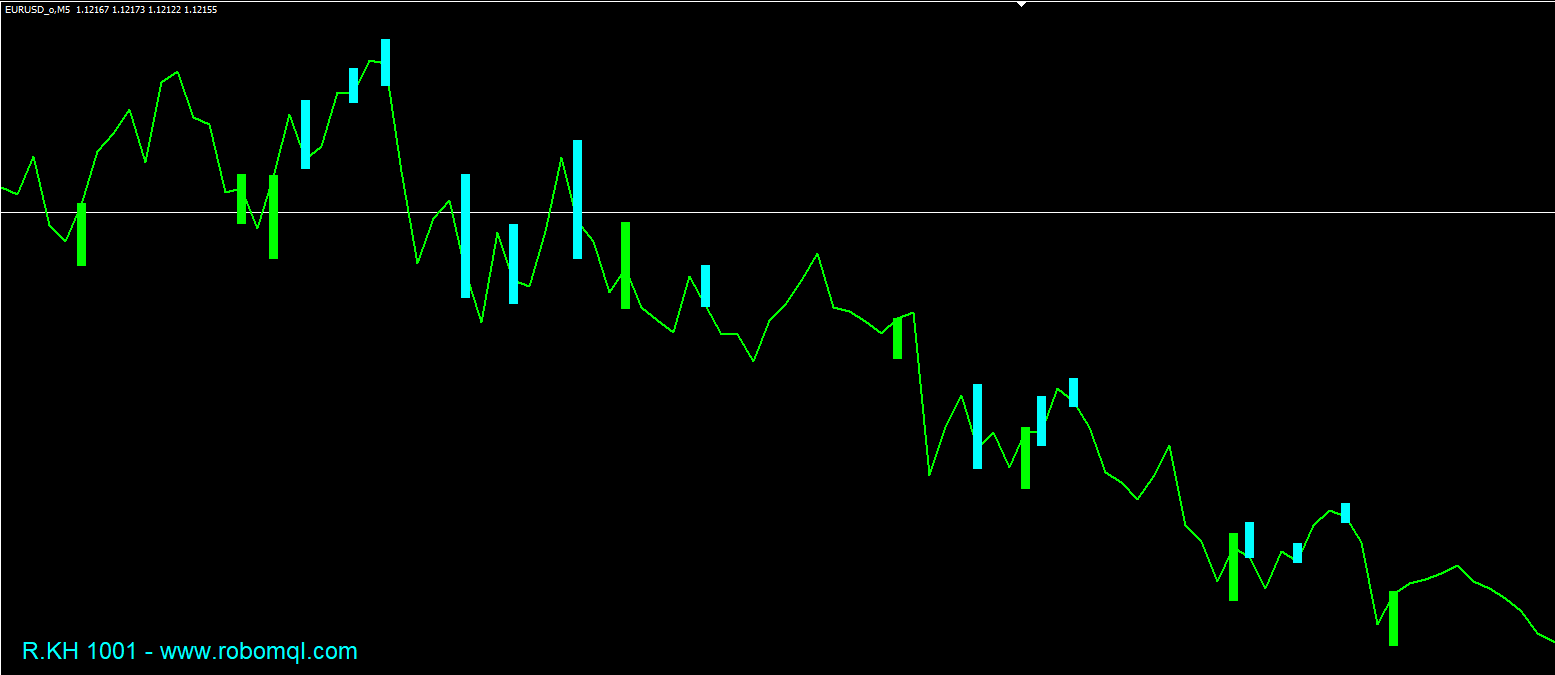
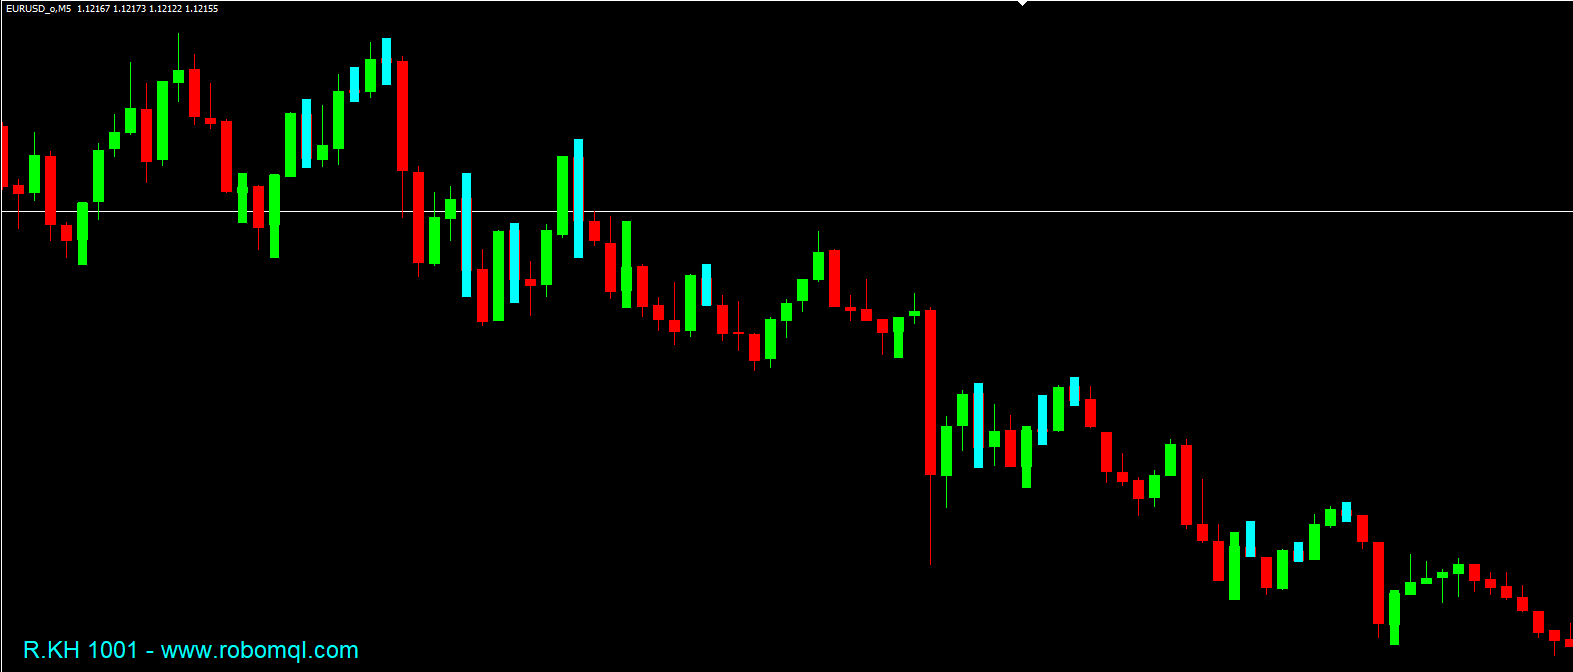
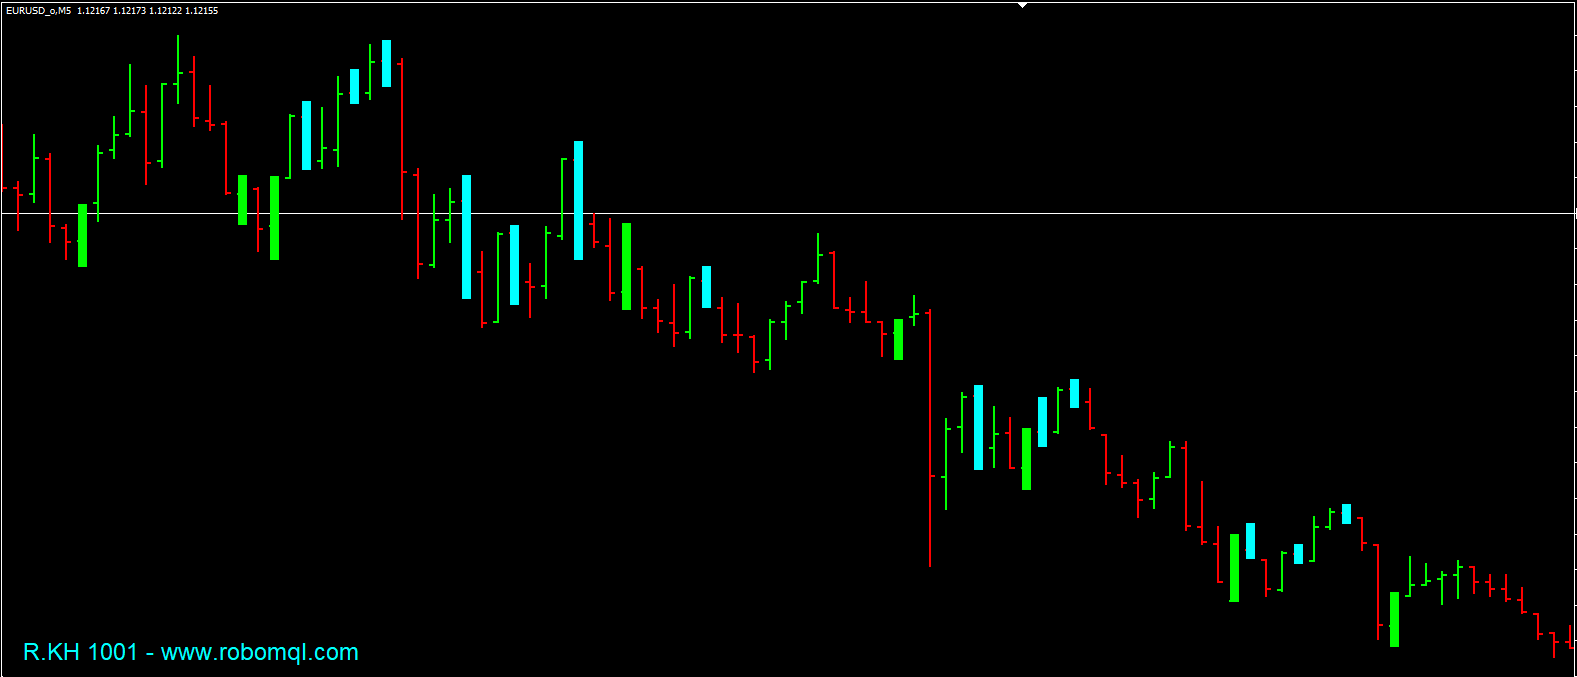
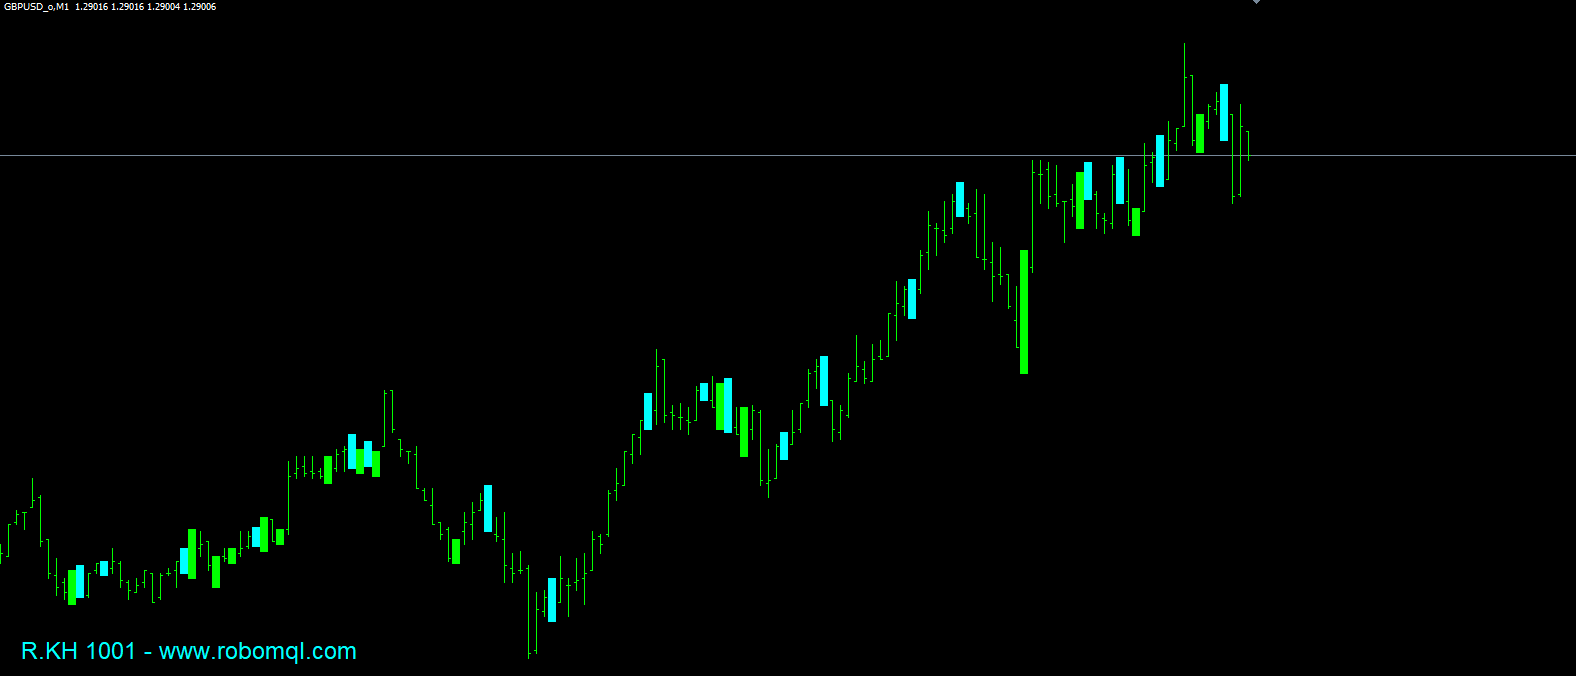
📈 Visual Output
The indicator uses two buffers:
val1[]: Bottom of histogram line
val2[]: Top of histogram line
The histogram visually connects high and low of a bar where a signal is found.
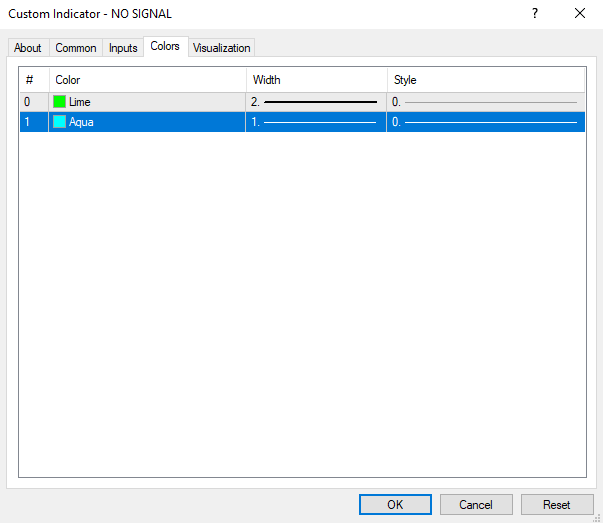
Color coding:
Lime (Green) for bullish IN patterns
Aqua (Blue) for bearish OUT patterns
Line Widths:
IN pattern = thicker line
OUT pattern = thinner line
🔔 Alerts
The indicator issues alerts for each detected pattern only once per bar.
Alerts display the type of pattern (IN or OUT) along with the chart’s timeframe.
🛠 How to Use
Attach to Any Chart: Works on all timeframes (M1 to MN).
Enable/Disable Patterns as Needed: Toggle Display_In and Display_Out depending on which patterns you want visible.
Interpret Signals:
IN pattern → Potential long entry or bullish trend continuation.
OUT pattern → Potential short entry or bearish trend continuation.
Use in Confluence: Combine with trend indicators (e.g., MA, MACD) or support/resistance for more reliable decisions.
🧑💻 Developer Information
Name: R.KH 1001
Website: https://www.robomql.com