


×
![]()
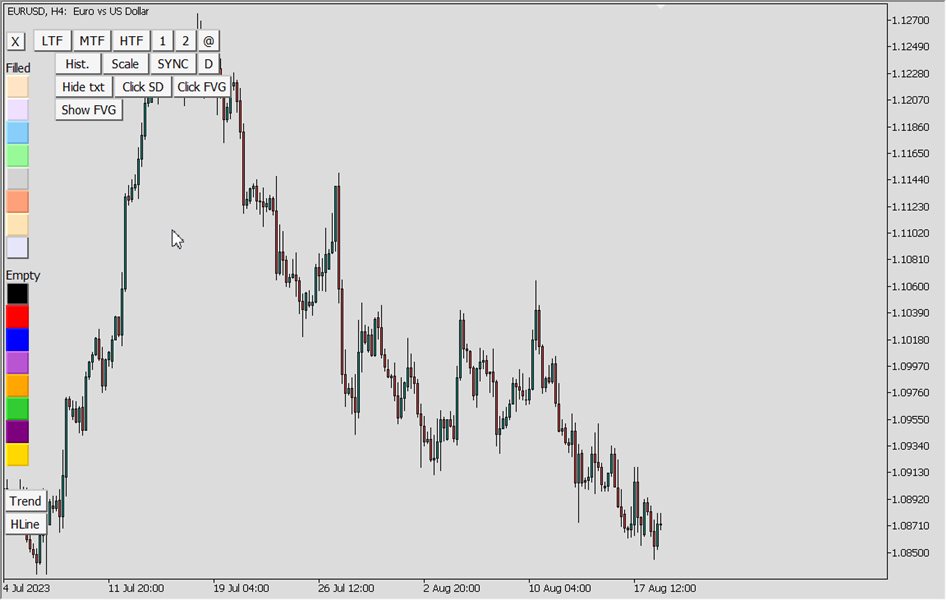
Trading box Technical analysis Version: 10.35
"The algorithm has undergone comprehensive refinement and structural enhancement to maximize your earning potential."
Everything for chart Technical Analysis indicator mt4 in one tool
Draw your supply demand zone with rectangle and support resistance with trendline and get alerts to mobile phone or email alert - Risk reward indicator
Video tutorials, manuals, DEMO download here. Find contacts on my profile.
1. Extended rectangles and trendlines
Object will be extended to the right edge of the chart when price will draw new candles on chart. This is rectangle extender or trendline extender.
2. Price touch alert
Alert will be triggered when price will touch extended rectangle or extended trendline
Trendline alert is also available for rayed angled trendline
Alerts can be sent to mobile push notification, email and MetaTrader popup alert
3. Engulf alert
Alert will be triggered when price will break rectangle supply demand zone
4. Candle Close alert
Alert will be triggered when candle will close outside of the rectangle or trendline
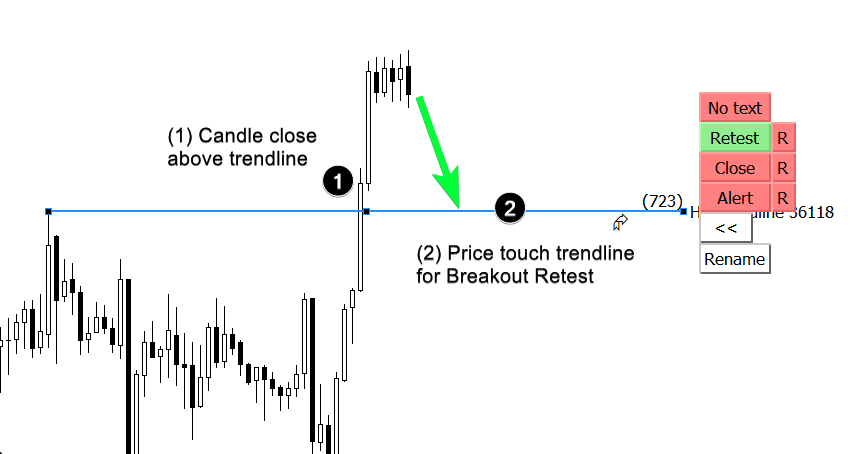
5. Trendline Retest alert
Button "Retest" is used for breakout and retest strategy. Breakout Retest triggers an alert if the candle closes beyond trendline and then price touches trendline for retest
6. Fakeout alert indicator
Detect candle pin bar or candle engulfing pattern created. We use false breakout indicator alert for fakeout trading.
7. Sound repeat after Alert, Engulf, Close, Retest, Fakeout
R button will enable you repeat alert sound every few seconds. Audible alert, text alert
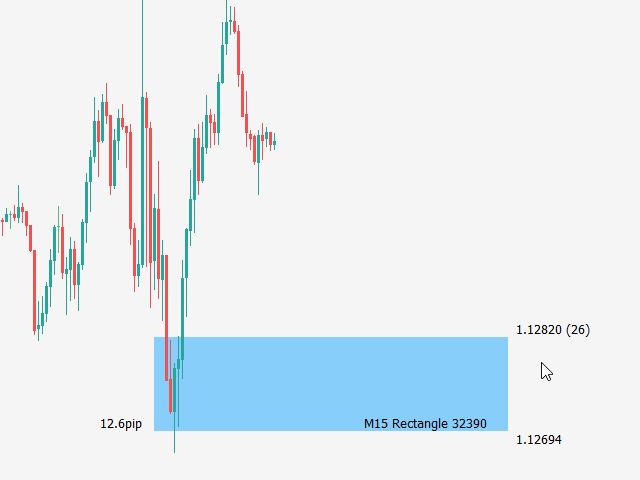
8. Risk reward ratio calculation tool
Risk reward ratio calculation for rectangles
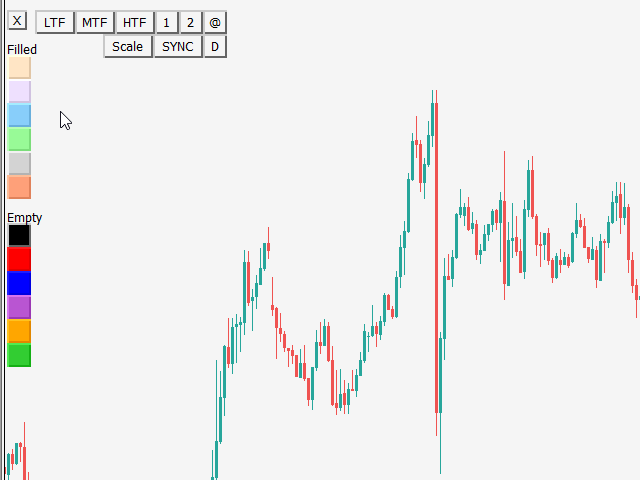
9. Color change buttons
Quickly change color for selected object with color button click. If no object is selected then color buttons will create a new rectangle
10. Text button - object name text position
Display rectangle or trendline text in all possible spots around or inside object. This works for non-extended rectangles and trendlines
11. Rectangle Split with % trendline
Rectangle will be split with extended trendline by 50% of rectangle height. When you move split trendline, then % (percentage) will recalculate
12. Rectangle Fibonacci retracement tool
Non-extended rectangle have option to split by % and give option to see discount or premium price of the rectangle
13. Trendline compression tool and Flat trendline button
Mark compression zone on the chart, like price action zone. If you click on Flat button then trendline will become horizontal flat
14. Chart synchronization - chart sync object
"SYNC" button function for rectangle, trendline, horizontal line, vertical line and Fibonacci retracement of the same symbol
15. Multiple timeframes analysis with nested zones
Bands button will create top and bottom rectangle lines visible on all TF but filled rectangle will be visible only on current TF. This will help you to see HTF levels on lower timeframes
16. Auto scale TF visibility for newly created rectangle & trendline
This function will set timeframe visibility for current and lower timeframes. This will give bigger importance to objects on higher timeframes
17. Object timeframe visibility buttons
Set object timeframe visibility with LTF, MTF and HTF buttons
18. Navigate chart to Rectangle origin position focus
Function that will show origin of selected rectangle in the middle of the chart when button @ is clicked
19. Horizontal break line price
Function will search first horizontal line break in chart history on the left
20. Hist. button
History button that will show the time of last alert in the label. Information is transferred to Technical analysis dashboard where you can see last alerts of all charts in one list
21. Rename the rectangle and trendline from the suggested list
Button Rename gives options to rename the rectangles and trendlines from the suggested list
22. Time Frame colors for new created objects
User can define special color for each standard time frame
23. Candle click to create SD zone
Button Click SD with ON//OFF logic for extended rectangle creation when user click on candle. Zone is based on candle High and Low price
24. Fair Value Gaps (ICT FVG indicator)
Button Click FVG with ON//OFF logic for extended rectangle creation when user click on Fair Value Gap zone candle
25. Button to show ALL Fair Value Gaps
Show all fair value gaps on chart with Show FVG button
Input settings:
Show FVG - Search bars in history (0 = default)
Show FVG rectangle color - Untouched/Untested
Show FVG rectangle color - Touched/Tested
26. Hotkeys for drawing Support Resistance levels and Supply Demand zones
Last clicked candle Hotkeys for Support and Resistance levels (extended trendline):
H - High
L - Low
O - Open
C - Close
Last clicked candle Hotkeys for Supply and Demand zones (extended rectangle):
S - Supply zone
D - Demand zone
F - Fair Value Gap
X - Show/hide TBTA buttons
W - Show FVG
Q - Chart Scale
1 - Line thickness
2 - Line thickness
3 - LTF
4 - MTF
5 - HTF
A - @ (Move chart to selected object Time1)
E - Extend/unextend selected trendline or rectangle
Save time withd software.
Related products.
$98

$85

$95