
Two Sides of the Market Indicator – Master Market Polarity
"See both sides of the market at a glance – trade with clarity!"
📌 Overview
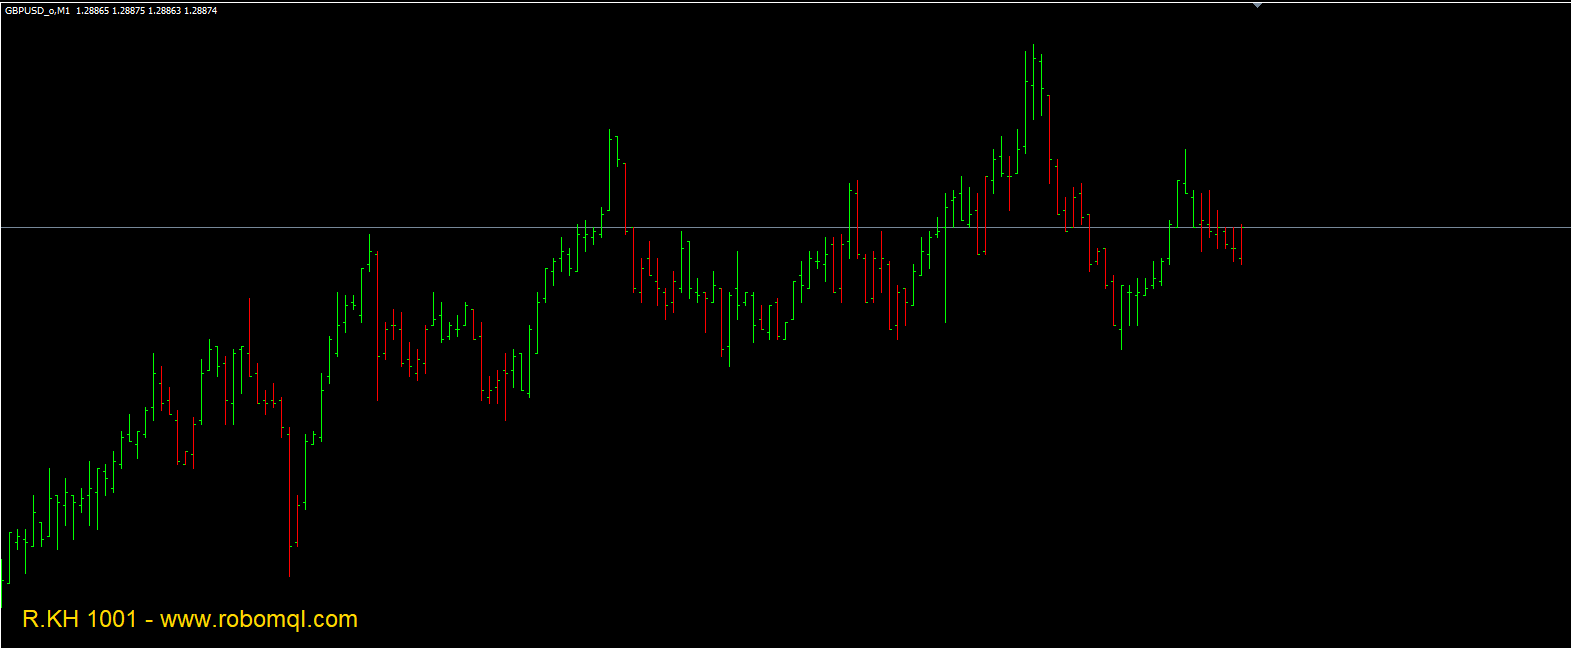
The "Two Sides of the Market" indicator is a MetaTrader 4 (MT4) tool that visually represents bullish and bearish momentum using colored histograms and price action analysis. It combines RSX (Relative Strength eXponential) calculations with moving averages to highlight trend reversals and continuations.
Key Features:
✅ Dual-Signal System – Clearly marks bullish (green) and bearish (red) phases.
✅ Non-Repainting – Signals remain stable once formed.
✅ Works on All Timeframes – Scalping to swing trading.
✅ Customizable Settings – Adjust sensitivity for different market conditions.
⚙️ How It Works
The indicator uses:
RSX Oscillator – Measures relative strength with exponential smoothing.
Signal Line (MA) – A moving average filter to confirm trends.
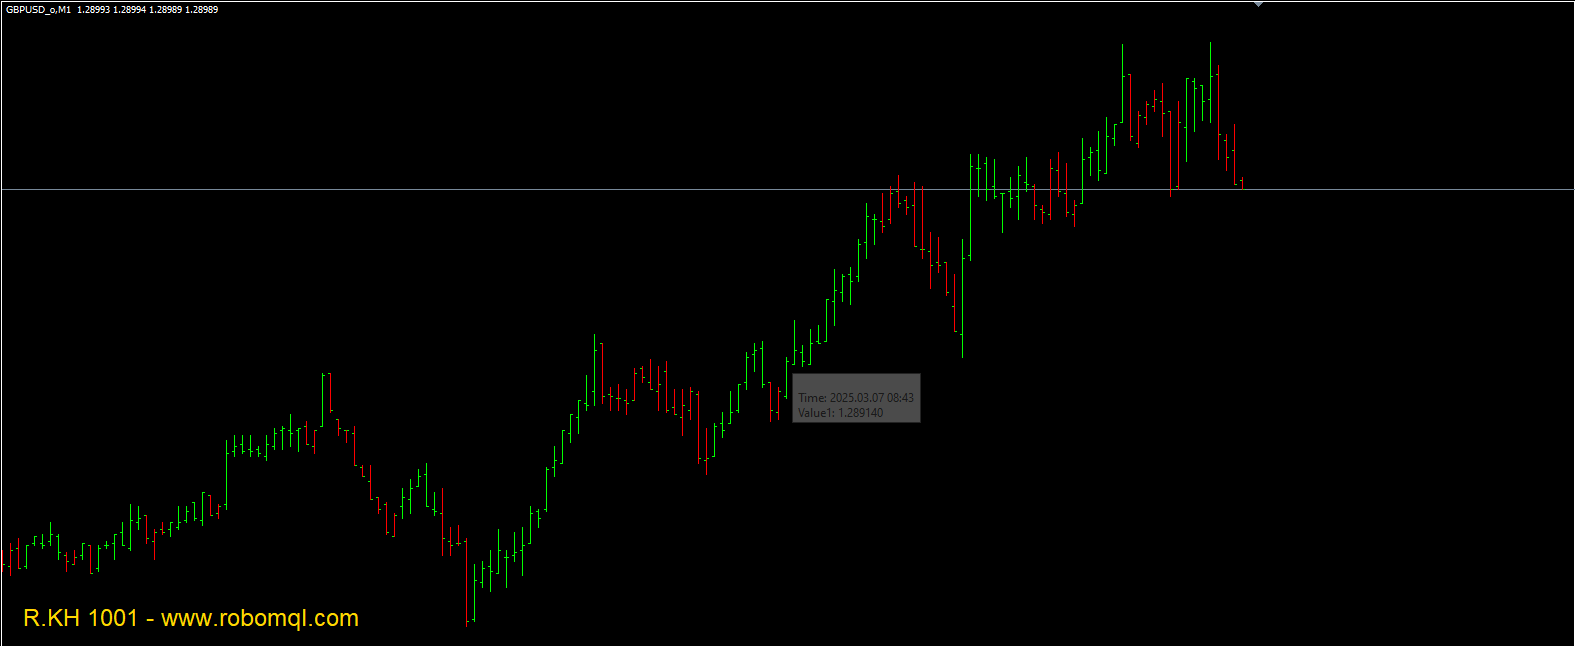
Color-Coded Histograms – Green for bullish momentum, red for bearish.
Shift Adjustment – Allows fine-tuning of signal positioning.
Signal Interpretation:
🟩 Green Bars → Bullish momentum (consider long positions).
🟥 Red Bars → Bearish momentum (consider short positions).
Yellow/Black Bars → Transition phases or weaker signals.
🔧 Key Settings & Configuration
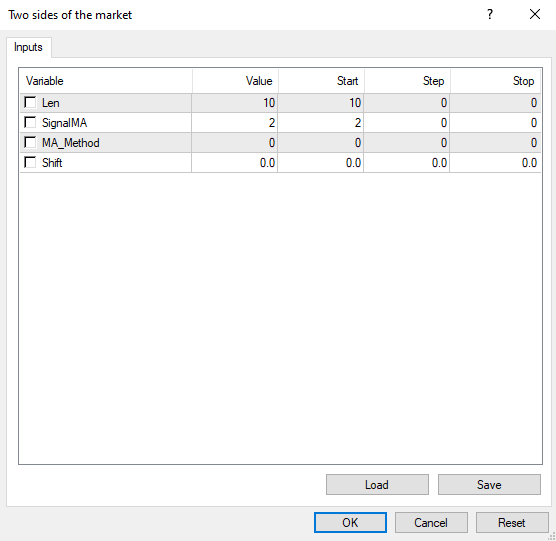
1. Input Parameters
ParameterDescriptionRecommended Value
Len = 10RSX calculation period (sensitivity)10-20
SignalMA = 2Moving average period for signal line2-5
MA_Method = 0MA type (0=SMA, 1=EMA, etc.)0 (SMA)
Shift = 0.0Adjusts signal position (in pips)0.0 (default)
2. Visual Elements
Lime Green → Strong bullish momentum.
Red → Strong bearish momentum.
Yellow/Black → Neutral/weak signals.
📊 Recommended Pairs & Timeframes
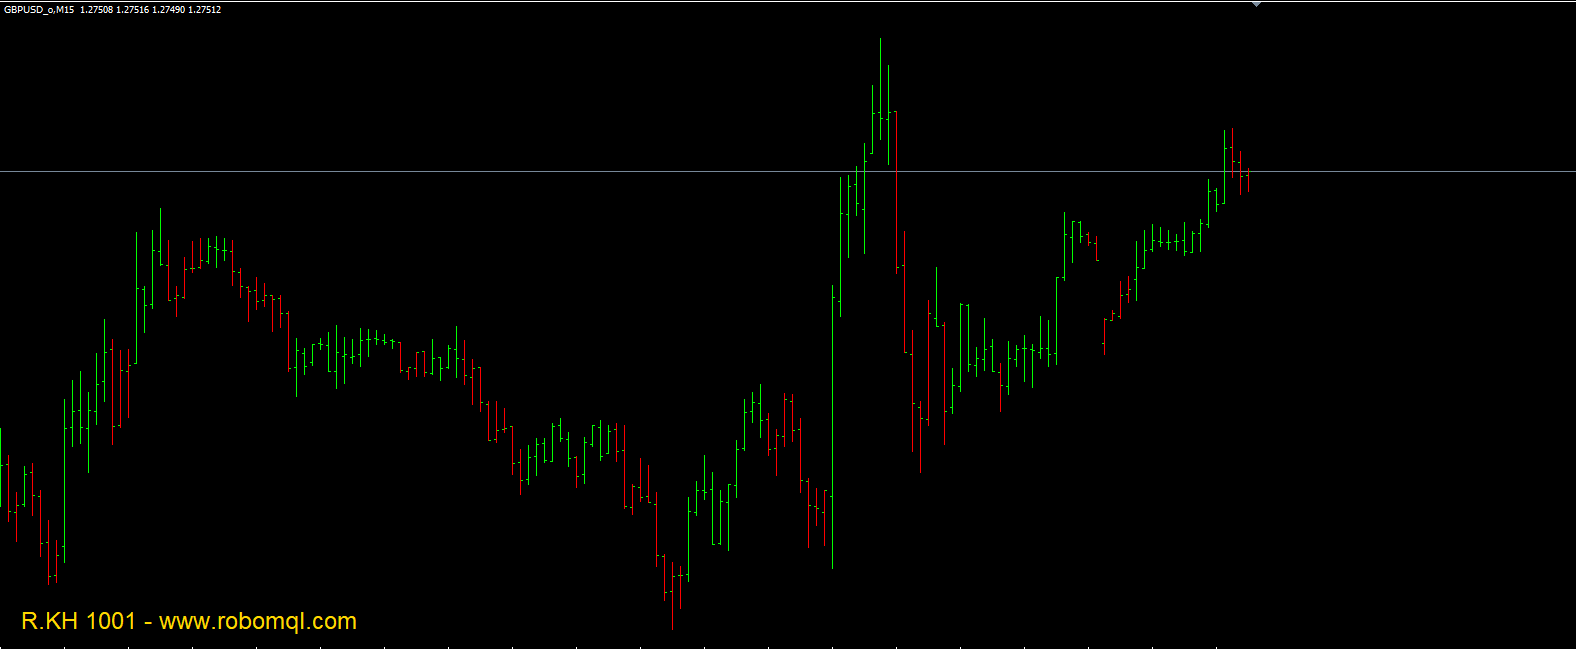
Best Pairs: EUR/USD, GBP/USD, Gold (XAU/USD).
Optimal Timeframes: M15, H1, H4 (works well for intraday to swing trading).
🚀 How to Install & Use
Download the .mq4 or .ex4 file.
Copy it to MT4 MQL4 Indicators folder.
Restart MT4.
Drag & drop the indicator onto a chart.
Adjust settings (optional):
Increase Len for smoother signals (fewer false alerts).
Decrease SignalMA for faster responses (but more noise).
⚠️ Important Notes
Combine with support/resistance levels for higher accuracy.
Avoid using alone in choppy markets (best in trending conditions).
Test on a demo account first!
📜 Developer & Source
Developed by: R.KH 1001
Official Website: www.robomql.com
🎯 Final Thoughts
The Two Sides of the Market Indicator is a versatile tool for traders who want a clear visual representation of market momentum. By combining RSX and MA filters, it helps identify high-probability entries while minimizing false signals.
Pro Tip: Use it alongside price action patterns or volume analysis for best results!
Happy Trading! 🚀